


Did you know that the US Geological Survey (USGS) has monitored water quality in Sligo Creek since 2008 and that you can access their current data in real time, as well as data from the past?
Find out what USGS has learned about Sligo Creek over the last 14 years, what the trends are, and how you can utilize the site. Join the Zoom talk on Thursday, February 24, at 7:30 pm.
Our speaker is Chuck Walker, associate director for data at the regional USGS Water Science Center in Baltimore.
The Zoom meeting link is: https://us02web.zoom.us/j/81397030340?pwd=R3oyVXU3M0RzcGNuUzNLSFJWbWZxdz09 If needed, the meeting ID is 813 9703 0340 and the passcode is 588110.
The Water Science Center in Baltimore serves Maryland, Delaware, and Washington, DC. It operates stream gages, observation wells, and monitoring stations designed, in the Center’s words, to “provide the reliable scientific information needed to understand our natural world.”

The USGS monitoring station near Maple Ave, with solar panel and antenna. (Tom Walton photo)
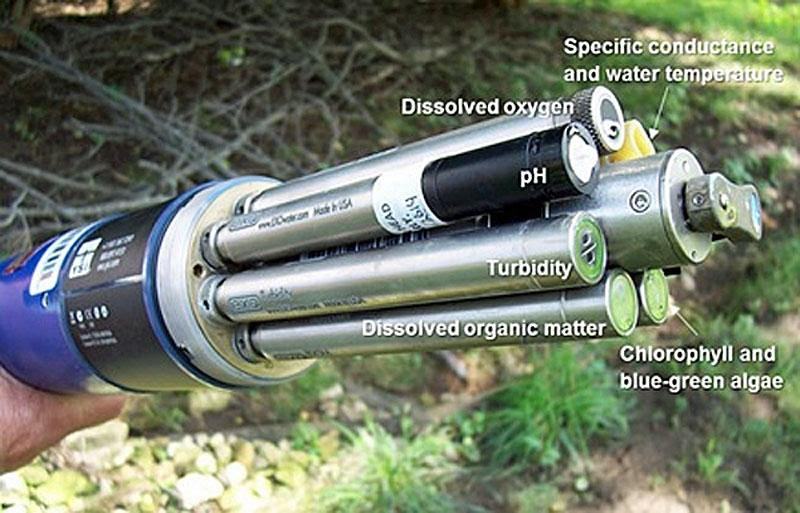
A USGS device similiar to the one submerged in Sligo Creek just upstream of Maple Ave. Ours does not measure algae or chlorophyll. (USGS photo)
The USGS dashboard for Sligo Creek tracks seven factors:
- temperature
- gage height (water depth)
- specific conductance (salinity)
- dissolved oxygen
- pH (acidity)
- turbidity (suspended sediments)
- discharge (volume of flow per minute).

The USGS monitoring station just north of the Maple Ave bridge. (Wilpers photo)
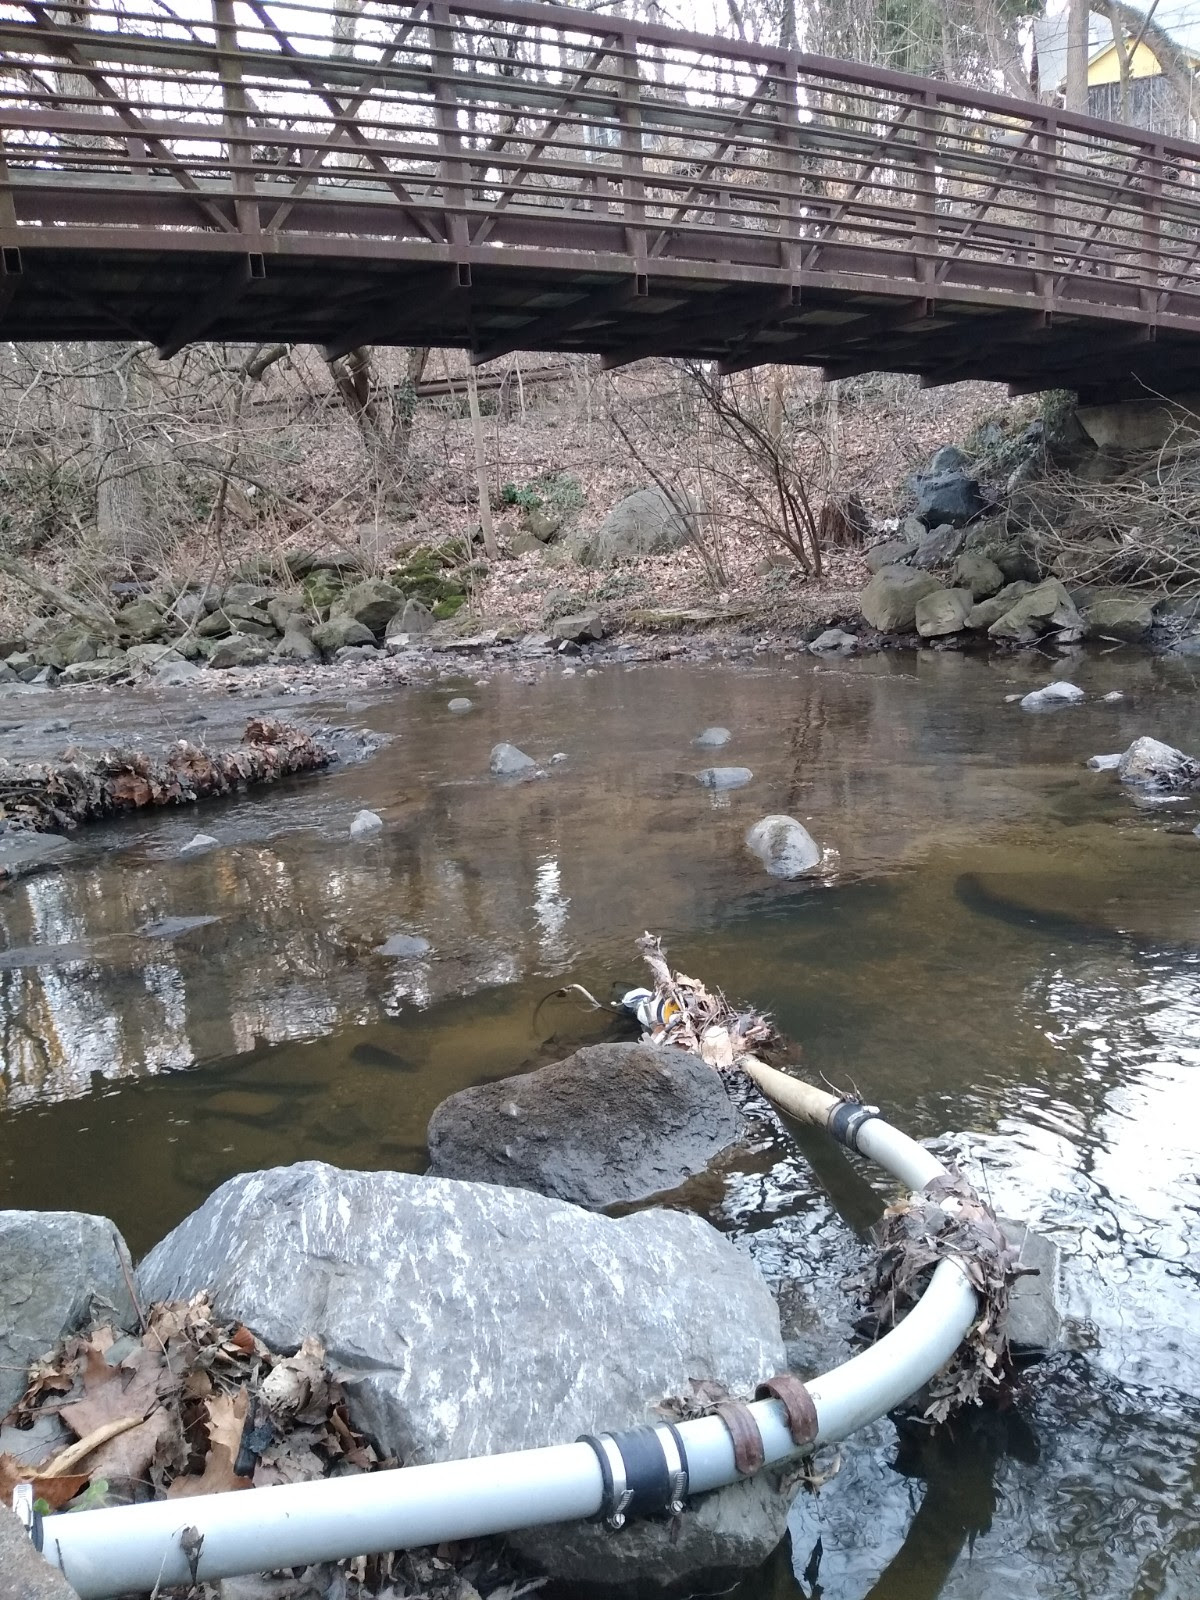
You can see Sligo’s gage from the foot bridge just upstream from Maple Avenue. USGS and the Montgomery County Department of Environmental Protection (DEP) fund the gage operation jointly.
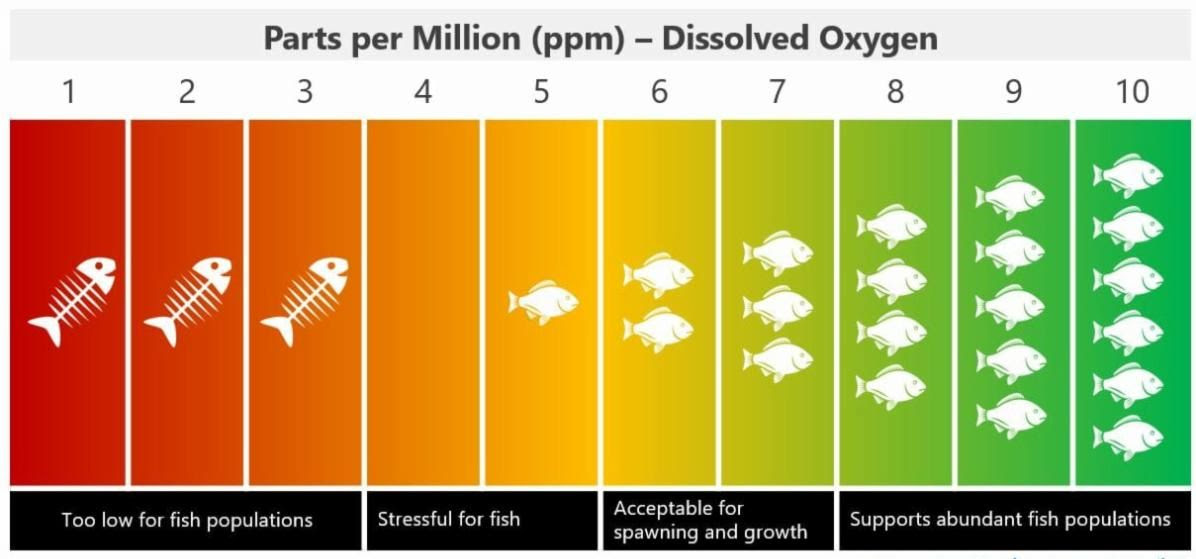
To explore what you can find on the USGS site for Sligo, choose a parameter to view. I chose dissolved oxygen which is critical to fish, insects, and other invertebrates who require oxygenated water to survive.
From the menu on the USGS landing page for Sligo Creek, click on “dissolved oxygen” which is below the initial graph for gage height. Then scrolled back up to click on the “change time span” box and enter dates. I entered 01/01/2015 and 01/01/2021, which produced the graph below. The six-year timeline is across the bottom. The horizontal lines in the graph correspond to 5, 10, and 15 milligrams per liter (parts per million).
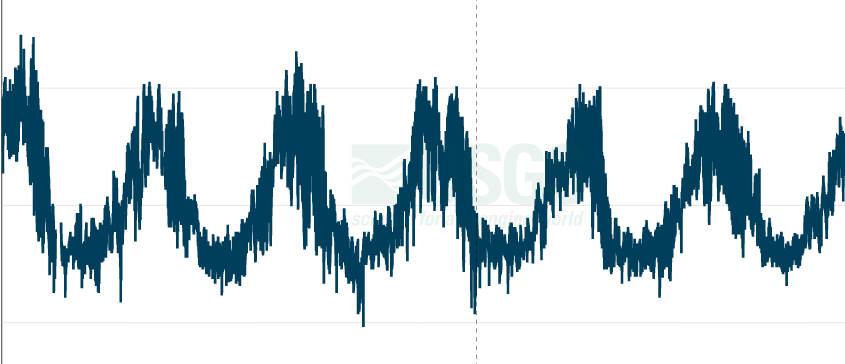
The level of dissolved oxygen over a 6 year time span, 2015 to 2021. The highs are midwinter, the lows, midsummer.
Compare our numbers with those in the bottom chart on oxygen levels that support freshwater fish:
For more information on this event, contact Mike Smith at [email protected].
— Michael Wilpers, newsletter editor