Salt Monitoring Initiatives
FOSC is conducting two Salt Monitoring initiatives to assess the impact of road/sidewalk salt on Sligo Creek and its tributaries (Long Branch, Wheaton Branch, Takoma Branch and others). You may have read about how the use of road salt in the winter is hurting our waterways and, because salt isn’t removed by water treatment facilities, is ultimately affecting our drinking water. The Water Quality Committee has started to do something about it…with your help!
I. FOSC SaltWatch Monitoring in the Sligo Creek watershed
|
|
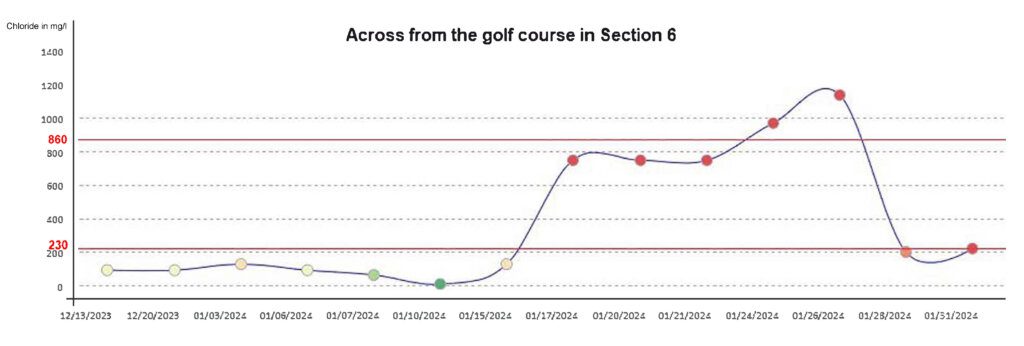
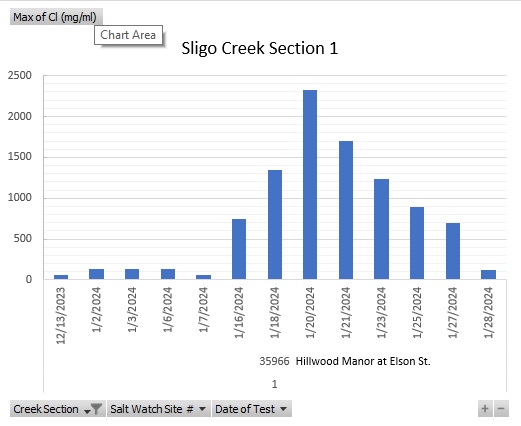
| The Long Branch graph, above, shows a typical salt “bump” from the storm in the first week of January. On Jan. 16th, the morning after region-wide salting was completed for the recent large storm, the chloride levels shot up and stayed up for 13 days straight, until Jan. 28th. |
|
II. Reporting Excessive Road/Sidewalk Salt in the Sligo Watershed
To help reduce the amount of salt entering Sligo Creek, we’re continuing the FOSC reporting program for excessive road or sidewalk salt “piles” (such as the piles shown in the photos at the bottom of the page) in the Sligo watershed.
We will follow up to ensure that the County, State or responsible party to remove excessive salt piles before they go into Sligo Creek. View examples of excessive salt use further down this page. The watershed map may be viewed on the Maps of Sligo Creek page.
III. Data Reporting for salt testing results
Results for Sligo Creek and other local testing sites
Winter 21/22/23
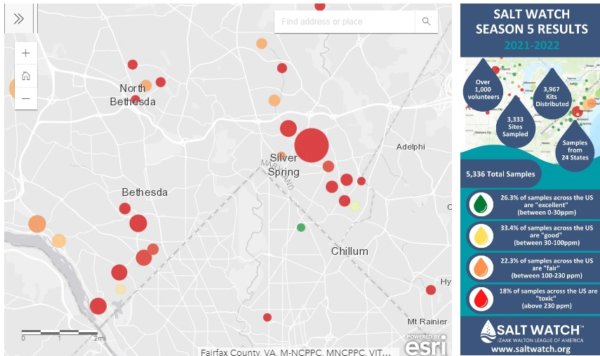
In the Washington region overall, the Izaak Walton League reports that Salt Watch testing results from 2021/22 showed 34% of streams had chloride at levels considered toxic to wildlife, or 410 ppm. Across the eastern and midwest US, 18% tested at that level.
Along Sligo and Long Branch, the average chloride levels at 14 test sites ranged from 216ppm to 507ppm, though FOSC volunteers’ data show individual readings as high as 860ppm during winter of 21/22. In the 22/23 testing, readings ranged from 43 at Three Oaks Drive on Jan 8, to 187ppm at Maple Ave and at Elson St, both also on Jan 8th just before the storm. On average, the salt levels were significantly lower in 22/23 season due to fewer storm events and a lighter hand with salt spreading by the County than in 21/22.
IV. Advocate for Reduced Salt Use and Alternatives such as Brining of Roadways
Let County Executive Marc Elrich and Director of MCDOT Christopher Conklin know that you support brining of roadways. Brining is as effective as rock salt for deicing but, because of the way it is applied, uses ~60% less salt than a roadway treated with rock salt. It would help protect wildlife in the watershed and county-wide, and save money too.
Please view the letters that the FOSC Advocacy Committee has sent to MoCo DOT, the MD State DOT , and others on this issue, as well as their responses. We are continuing to follow up with these groups to press for better training, higher quality equipment standards for contract salt applicators, and other measures to reduce excessive salt use.
#
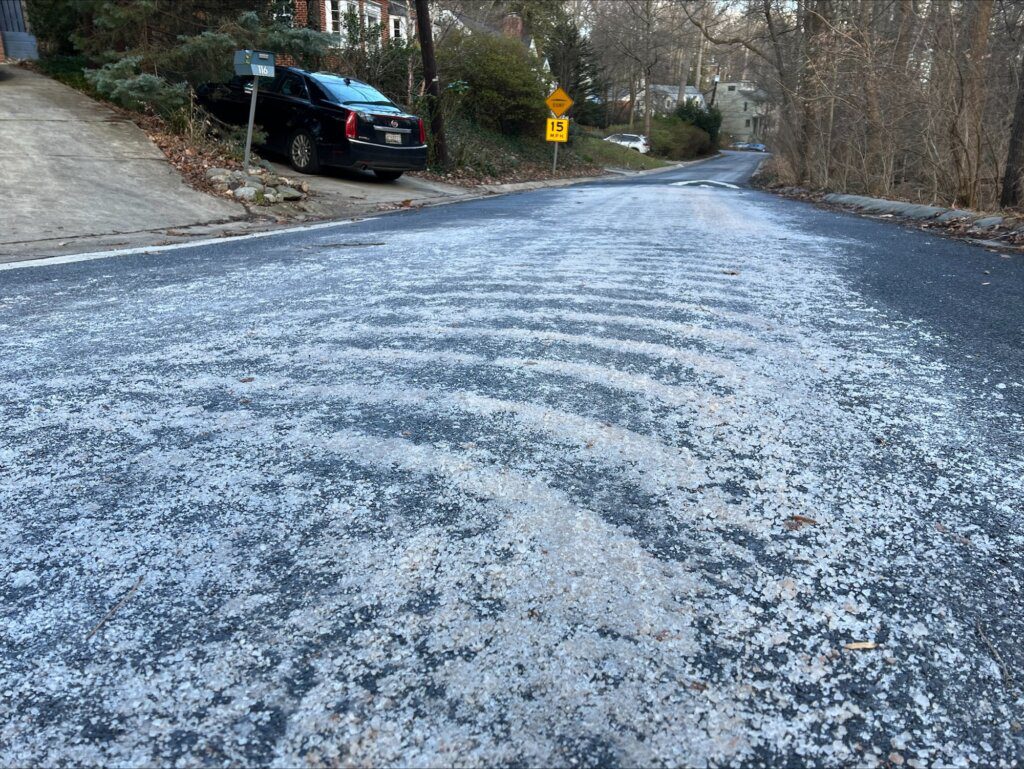
A mega-salt application - unencessary and damaging to the creek just downhill from this location.
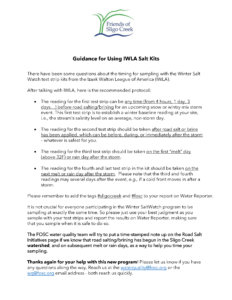
The IWLA is providing the test kits for the FOSC salt monitoring initiative. Thank you, IWLA!

Excessive salt piles at Dallas Ave near Sligo Creek
Large salt piles in a Dallas Ave intersection close to Sligo Creek. DOT removed them shortly after the FOSC Section Steward reported them.
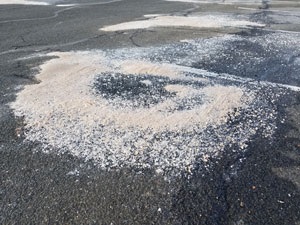
A local salt pile, courtesy of J. Galella at UMD
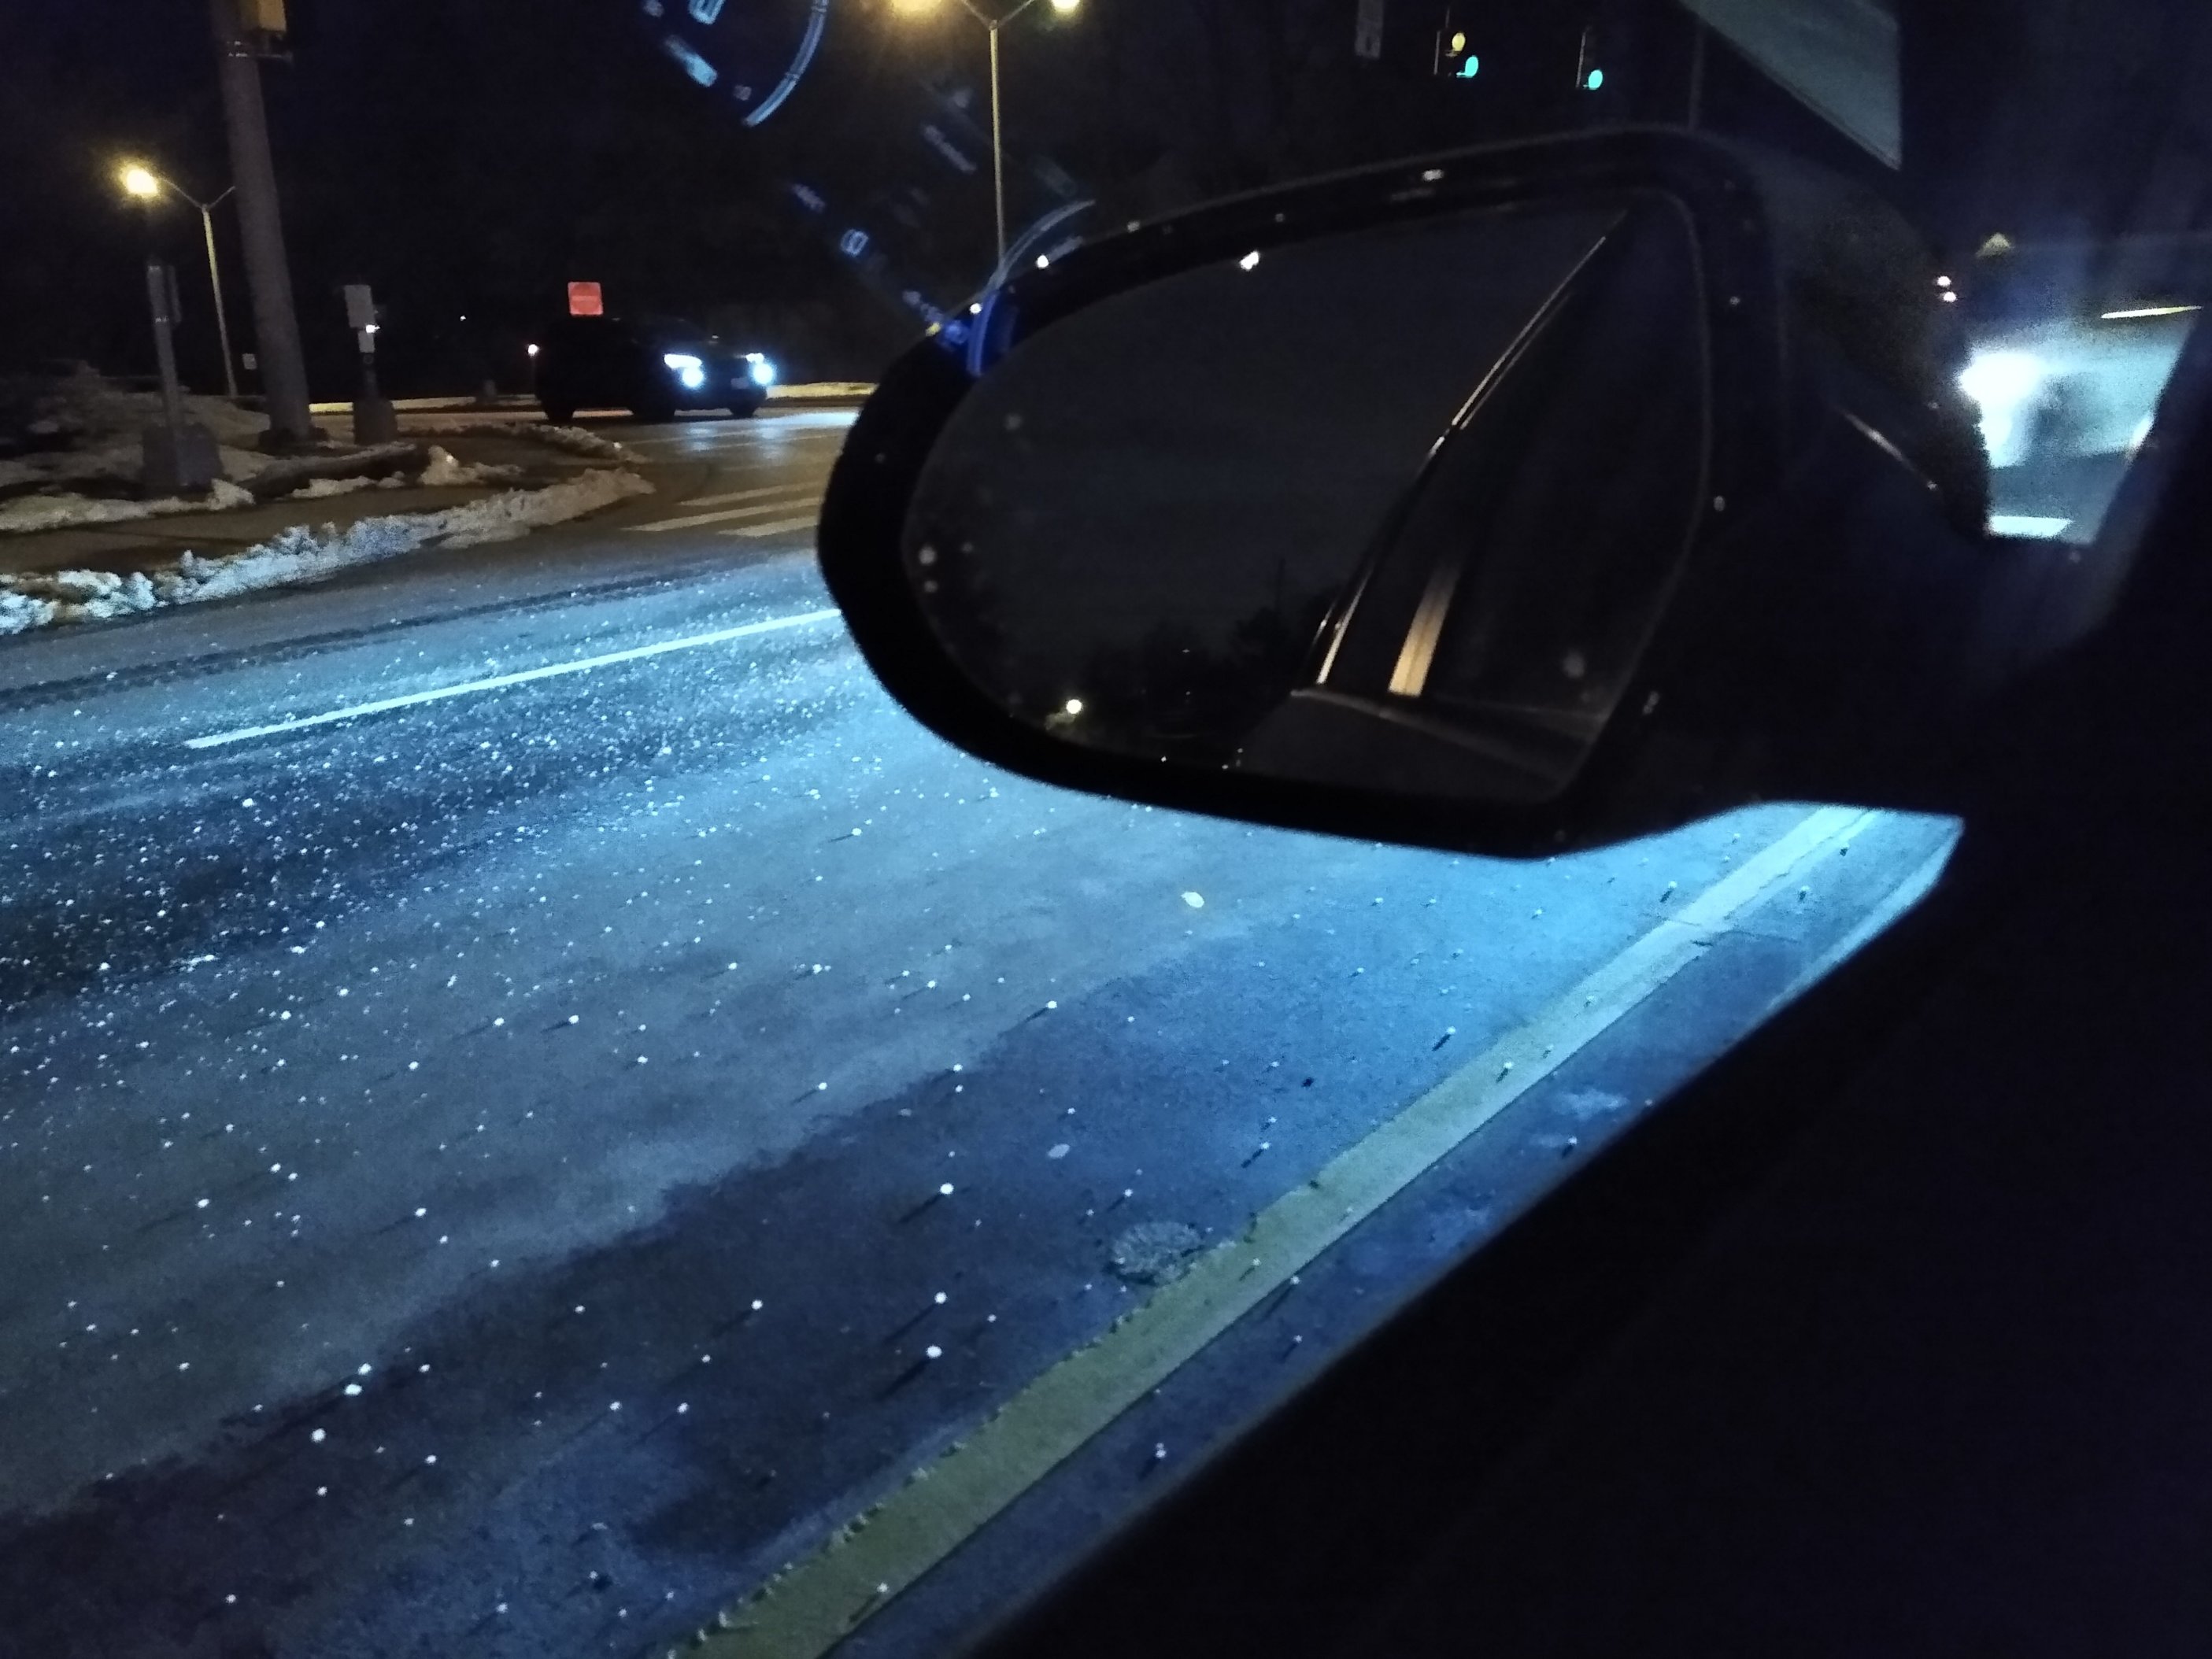
Road salt sprinkled on snow-cleared roadway
FOSC Advocates for More Responsible Salting Practices on Roadways
FOSC recently shared our strong concerns about the excessive salting in the watershed with the Montgomery County Dept. of Transportation, the Dept. of Environmental Protection, and the State Highway Admin, which maintains the numbered roadways (University Blvd, Colesville Rd, Georgia Ave, Piney Branch, etc.) The letter is posted under the Advocacy tab, Letters and Testimony page.
2023 MoCo DEP/WSSC
SaltWise Guidance
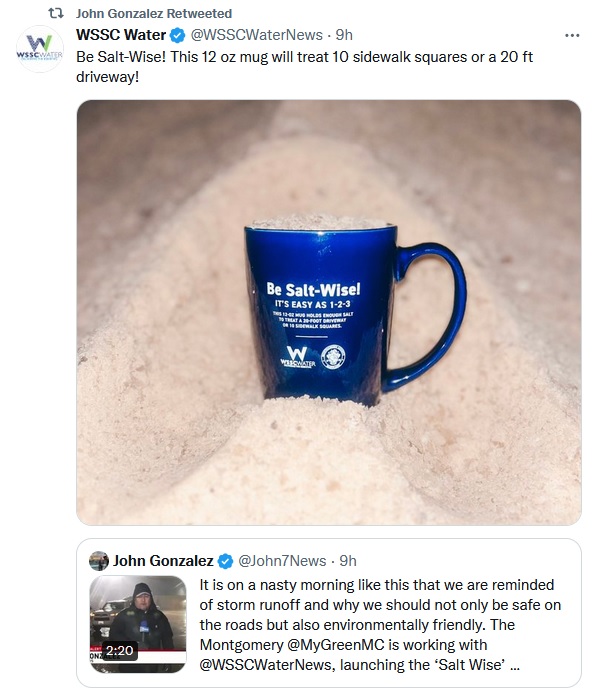
Be salt wise!
One mug of salt will treat a 20′ driveway or 10 sidewalk squares
The FOSC Water Quality team has rounded up these three handy salt use resources:
- Ways to manage your use of salt this winter – the County’s Department of Environmental Protection (DEP) has advice whether you’re a resident, business or other organization.
- For the status of salting/brining in your area, see the Montgomery County Winter Storm Information Portal – shows MCDOT’s latest storm management actions.
- The City of Takoma Park Public Works Dept – although there is some overlap with Montgomery County, the City of Takoma Park runs a separate salt management program.

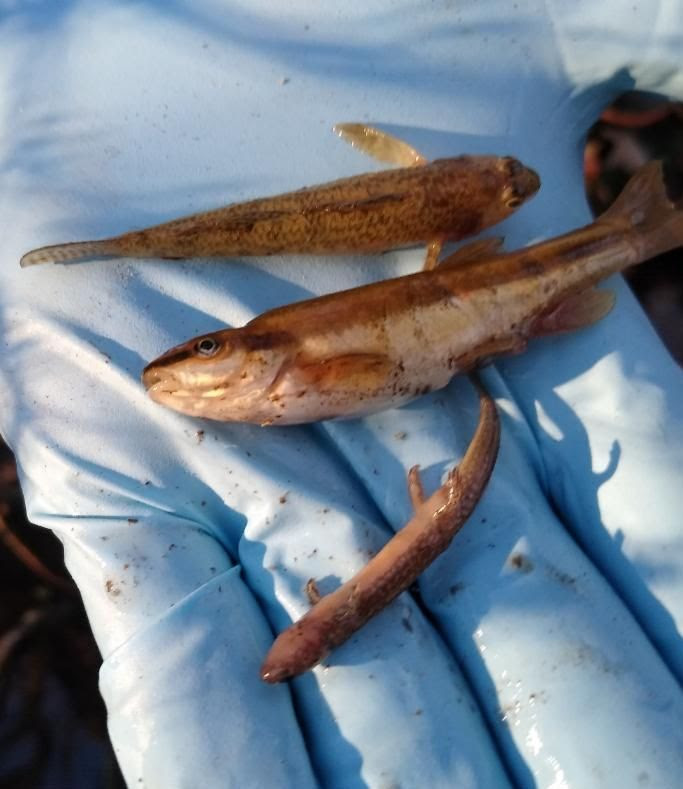 Fish kill on Flora Lane in Feb. 2021. More than 200 fish and salamanders were found dead by FOSC testers along Flora tributary. An investigation by the MoCo Dept. of Environmental Protection found the cause was excessive salt runoff, very likely from the Beltway.